chartbrew
An open-source reporting platform that enables building and sharing real-time dashboards from APIs and databases.
- Region
- Overseas
- Pricing
- Free
- Open source
- Yes
- GitHub Stars
- ★ 3.9k
- Views
- 3
- Source
- GitHub
- Added
- 2026-06-11
- Last verified
- 2026-06-11
Overview
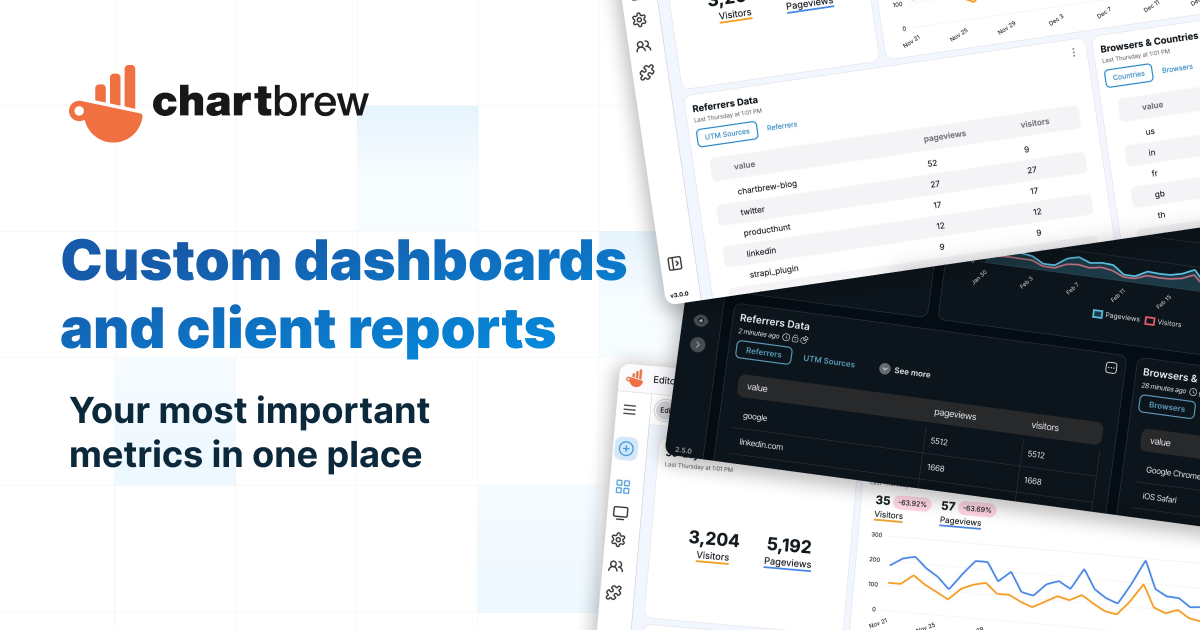
Chartbrew is an open-source web application that connects directly to databases and APIs, allowing users to create visually appealing charts using this data. It features a chart builder, editable dashboards, embeddable charts, query and request editors, and team collaboration capabilities. With a powerful AI assistant, users can easily manage and schedule reports. Suitable for individuals and organizations needing data analysis and visualization.
Key features
- ▪Supports multiple data sources
- ▪Powerful AI assistant
- ▪Embeddable charts
- ▪Team collaboration features
Use cases
Pros
- +Open source and free
- +Supports multiple data sources
- +Easy to deploy and use
- +Powerful AI assistant
Limitations / notes
- -Requires internet connection
- -Higher learning curve
Who it's for
This overview was compiled by AI from public sources and may contain inaccuracies — please refer to the official site.
FAQ
Is it free?
Yes, Chartbrew is open source and free.
Does it support Chinese?
The documentation and interface are primarily in English, but custom language support is available.
Can it be used commercially?
Yes, Chartbrew is open-source software and suitable for commercial use.
Similar agents
QuantMind
An AI-native, multi-market quantitative trading platform for individual developers and research teams.
ai-berkshire
An AI-powered multi-agent parallel research framework providing professional-grade investment decision support.
easy-stock
A-share market analysis and AI-powered research workbench offering stock analysis, quantitative trading, and post-market review.
TradingAgents-astock
A multi-Agent research and investment framework for A-shares, featuring 7 AI analysts debating decisions based on A-share market rules.
WrenAI
WrenAI is an open contextual layer that provides AI agents with the semantics, memory, and governance needed for business data queries.

Domery
Domery is a full-chain data AI assistant launched by Tencent, supporting multi-platform tracking and multi-source data analysis.
Something wrong? Let us know on the About page and we'll fix it.